How to Read a Waterfall Chart
For a couple of years now, everyone has been hearing about such a tool as Google PageSpeed Insights, but there are older and cooler tools to control the loading of pages on your site. Today I propose to talk about such a cool tool as the Waterfall Chart. (waterfall diagram). I think, many saw it when searching for various services for assessing the speed of loading a site, but understand, how it works only units.
What is Waterfall chart for and how it works?
Maybe, The biggest advantage of such a diagram is the fact, what can we track as specific page assets (scripts, Images, style, vector elements, server status and more) affects site loading, the ability to evaluate each individual page is also important.
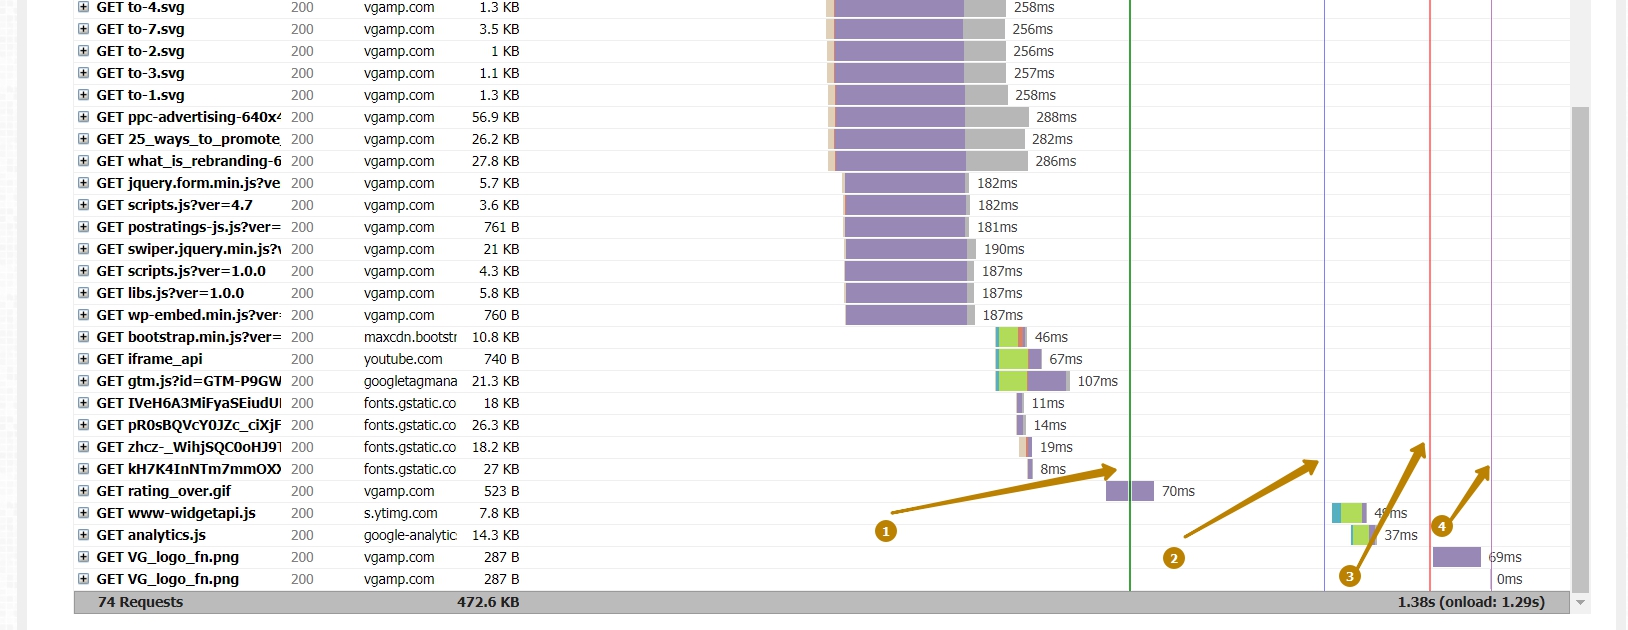
If you run a chart like this, you may be confused by a bunch of obscure terms. For example, I will take the site of one of my clients to whom we made a turnkey site, and show his diagram (vgamp.com). I will use the tool gtmetrix.com. I like this service due to the comprehensive site check, a variety of tools and after analysis, you can also use the Waterfall chart in it. So, validation example

At the end of the first column we can see the number of requests, in my example they 74 and the size of the whole page 472.6 kb. On the right you can see the page load time 1,29 seconds and the moment of complete completion of the onload event 1.38 seconds.
In this example, in the first column, You can see, that all requests with a GET method (getting elements), there are also POST requests, but now it's not about them. Sprites can be used to reduce GET requests, this is when all the small images on the page (mostly icons) are assembled into one image and then displayed in the background of elements using CSS, and to display different ones, the background is simply scrolled (changes position). Pretty handy method for icons, but when using SVG elements, you have the ability to embed them in the page and then the server does not need to look for them, they will be generated during the loading of the main HTML code.
If in the first column you hover over the resource name (Pictures, script... ), you will see the full path where the loaded resource is located on your or a third-party site. To view more detailed information, just click on the name of the resource, as shown in the picture below.
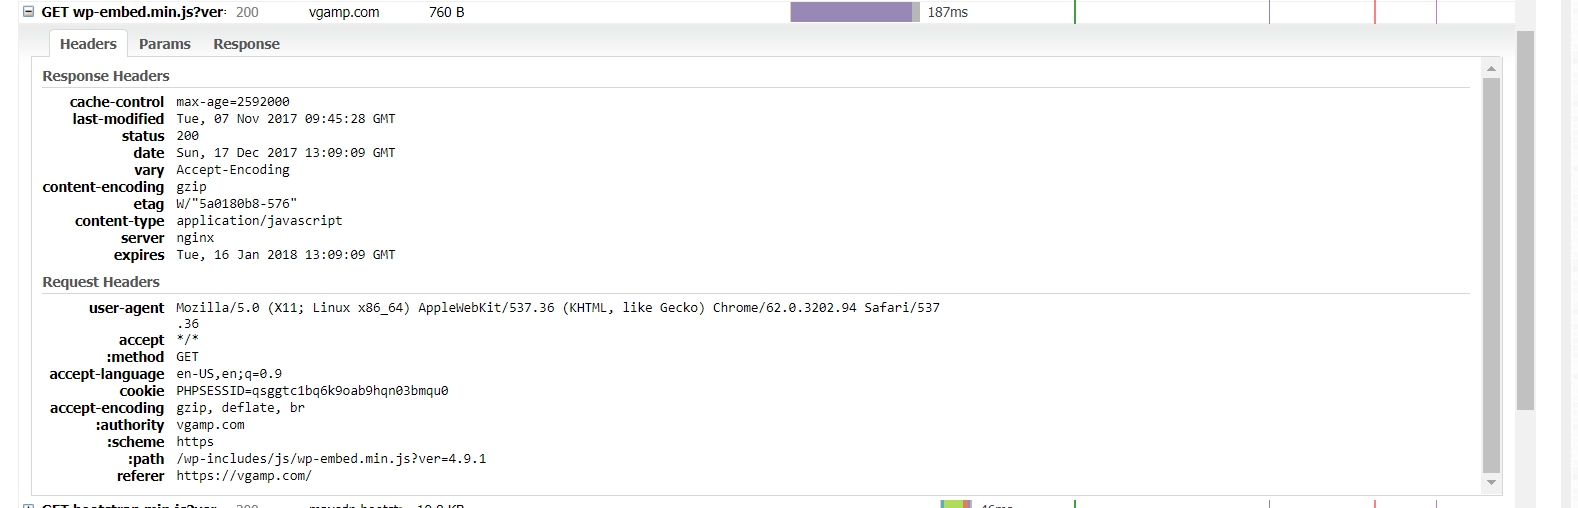
Let's consider each item that is important for page loading speed separately.:
- Status - server response code, it will be right, if it's worth 200. If you receive a code 404, 301 or 500 means, something went wrong and it will slow down your page. Read more about server response codes on Wikipedia.
- Content-encoding - in this case it shows, that the element was compressed using the GZip method and that's good, since such items will load faster.
- Content-type – shows what type of element is checked.
- Server is a server, which is configured on your hosting, in our case it is nginx.
- Scheme - we have it HTTP, working through SSL encrypted transport mechanisms. Useful for the safety of data during transmission on the site, especially for shops. It is important that all connected files on your site have the same protocol type., same as on your main page. If you have HTTPS, then all files must be HTTPS, an exception may be external links to websites (not files).
- Path – path to the file being checked.
Single file legend in site performance evaluation
Unusual word legend, stores data on downloading a separate file, it is displayed when hovering over the bar in the central part of the diagram and looks like this:
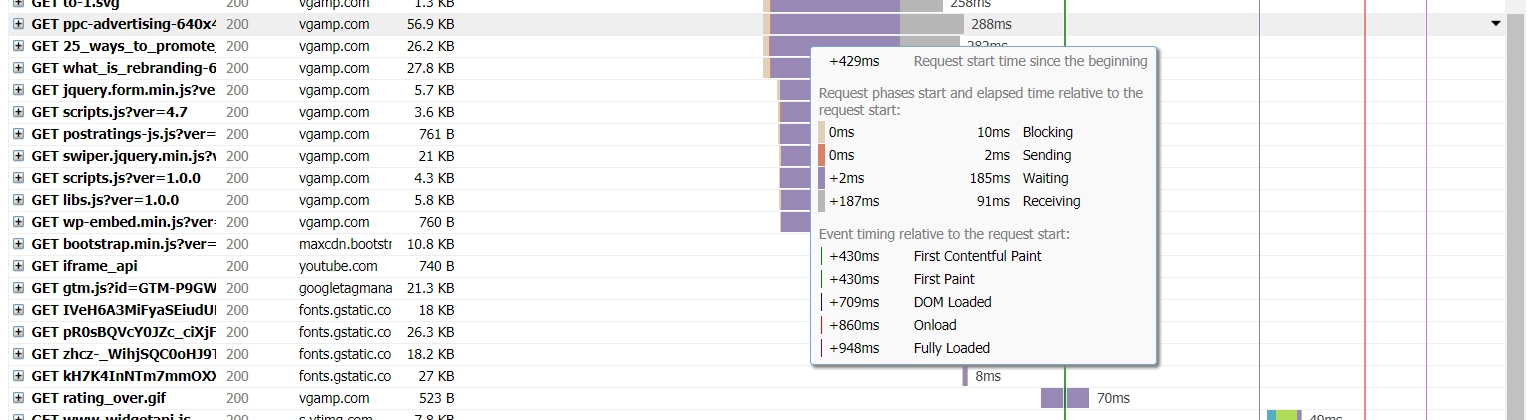
The legend shows, what happens to the file request in the form of different color schemes. There can be many query phases in the legend, the main ones are: blocking (light gray), sending (red), expectation (violet), receiving (grey). Colors may vary on different services, but the definitions are usually the same.
Brief definition of individual request phases, which we can see:
- Blocking: time, spent in the browser queue, pending network connection.
- DNS lookup: time for DNS resolution.
- Connecting: time, needed to create a TCP connection.
- Sending: the time the request data was sent to the server.
- Waiting: server response timeout.
- Receiving: response body load time.
Until I wrote an interpretation of the article in Russian, you can read more about the different phases of a request here. This is if you want to take this very seriously.
Document upload limits
Also in the diagram you can see several lines of different colors, as shown in the picture below.
Consider, what do these lines mean:
- First site display, although many who analyze the speed of loading sites, associate the output of elements already with the stage [3].
- Full loading of page DOM elements. going on, when all elements are loaded and parsed.
- Completion of the onload event. In some cases, elements may finish or start loading after the onload event.
- Full loading before and after the onload event.
Your Waterfall charts are likely to be more complex than this., but we have considered the basic principles and analyzed our toolkit.
How to Navigate and Optimize a Page with a Waterfall Chart
Now that we already know a lot about this diagram, let's look at some points that make it easier to identify problems on it..
The example below has snapshot with incorrect server response 404 and 403, near you can see, how slow is the page loading.
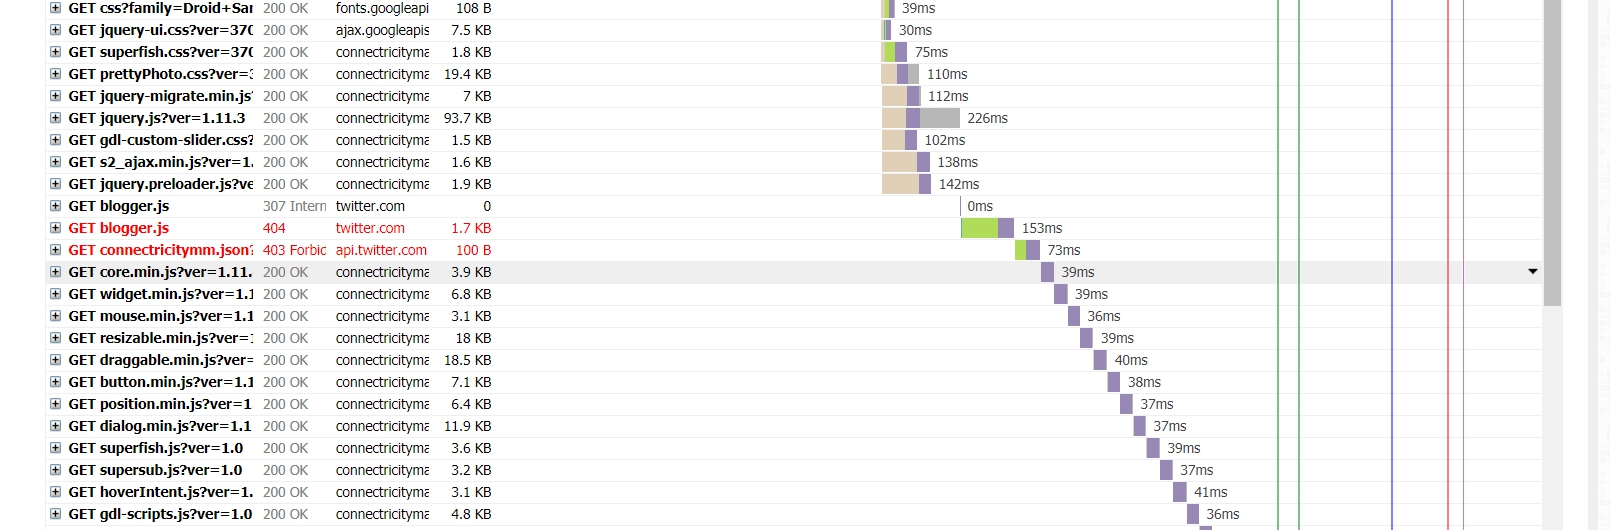
Look for particularly long graphs on the chart and check, what parameters make this delay. Sometimes the engines themselves on which the site is made are extremely slow, sometimes a slow module or the programmer just got stupid and made recursion where it was unnecessary to do it ). In general, the last option from illiteracy is the most frequent. It also happens that the client saved on quality and everything was done to just look beautiful..
Here is an example I have:
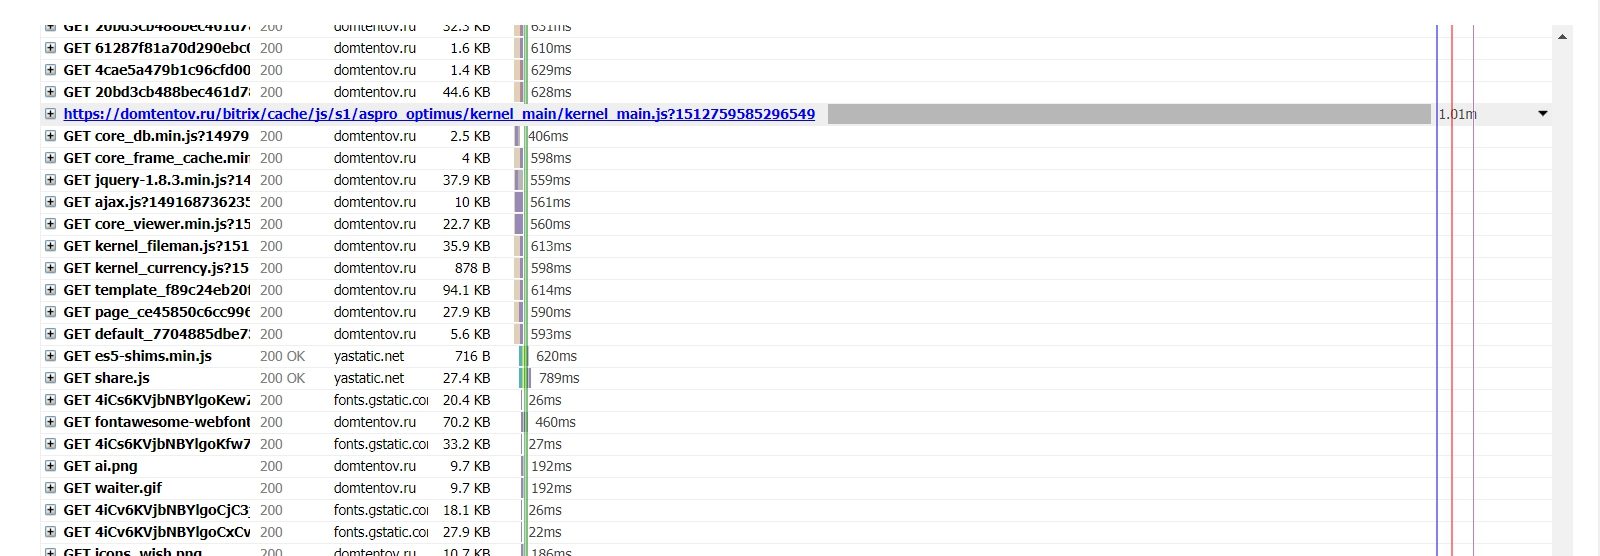
The example above shows a long file receipt, in which scripts were collected to speed up the site, but the developer completely forgot to clean up the number of unnecessary scripts. This is a terrible example., when the site is fast but crooked hands made it slow.
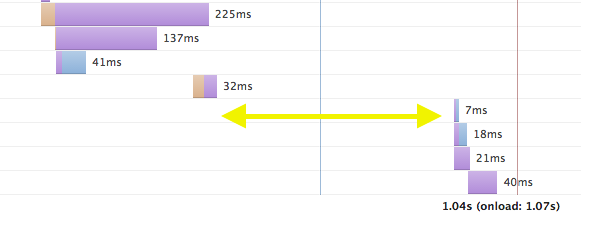
It also happens that there are long intervals between requests. This may be when the user's browser hangs or javascript is being executed.. I did not find such an example on my sites, so I found an example for you on the net, google is always helpful.
Thank you for reading this article to the end. I hope this article has opened your eyes a little., then how to parse waterfall diagrams.
If you need to speed up the site according to the waterfall or PageSpeed diagram, or you just don't like it, how long does your site take to load, feel free to write to me I will help. The service will not be free., because time costs money, if you just have questions about the article, then write in the comments or in my social networks, where we will solve them together.

/*

- Basic web design course;
- Site layout;
- General course on CMS WordPress and continuation of the course on template development;
- Website development in PHP.