How to use Google Search Console for SEO: Lesson 2 “Google Search Console Interface”
To get started, you need to sign in to the Google Search Console website and register there.. After registration is 2 how to get started:
- If you are promoting a client site. You need to request access to your gmail mail, to make the site appear in your google console.
- If you have your own website. You need to add it to Google Search Console.
Let's take a closer look at how to add a site to Google Search Console or open access.
How to open access to Google Search Console statistics
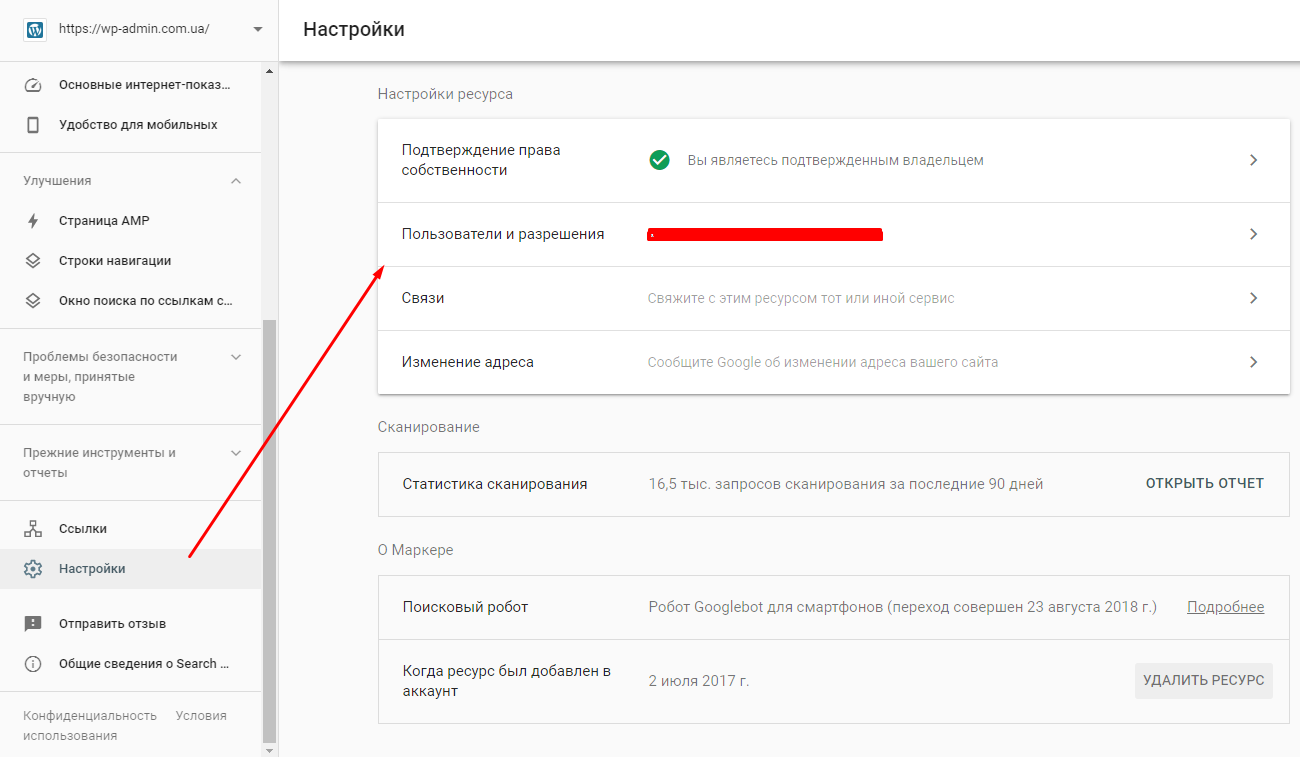
Your client, which will open access to the Google Search Console must go to the settings.

In the settings, select “Users and Permissions”.
Then press the button “Add user” and add a new user.
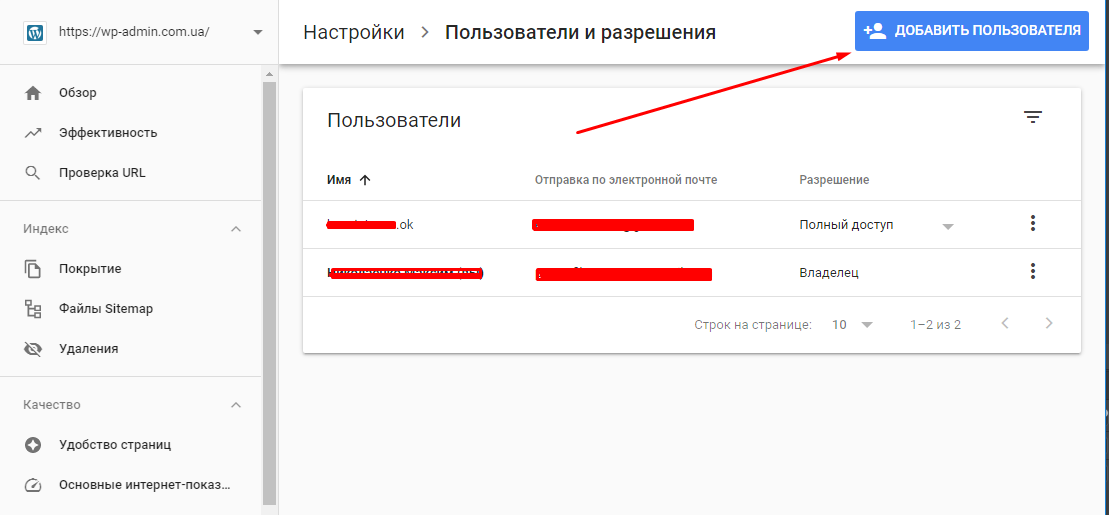
Once you have access, you will be able to see all the data on the client's website.
How to add a site to Google Search Console
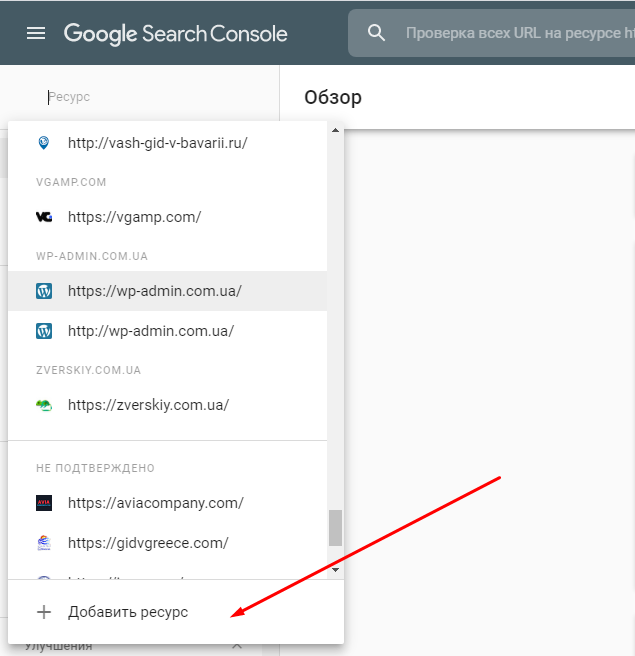
First time if you don't have websites, Google itself will offer to add your site to the console, everything is simple here. If you already have websites, then you need to click on the drop-down list at the top near the google search console logo and select “Add resource”.
After that you will get a pop-up window, where you will need to specify your site in one of the sections.
- If you enter your domain in the section “Add resource“, then you or your programmer will need to register a special TXT record at the domain name registrar to verify the site in the console. After that, you can work with him.
- If you enter your domain in the section “Resource with URL prefix“, then most likely the easiest way to verify is to upload a file to your site or add a meta tag to the site code. It is usually used if there is no access to the registrar or if you need to specify a URL with an additional tail, for example, for language versions of the site where there is /en/ or /ua/. For language versions, sometimes they are added separately to see data for each version of the site.
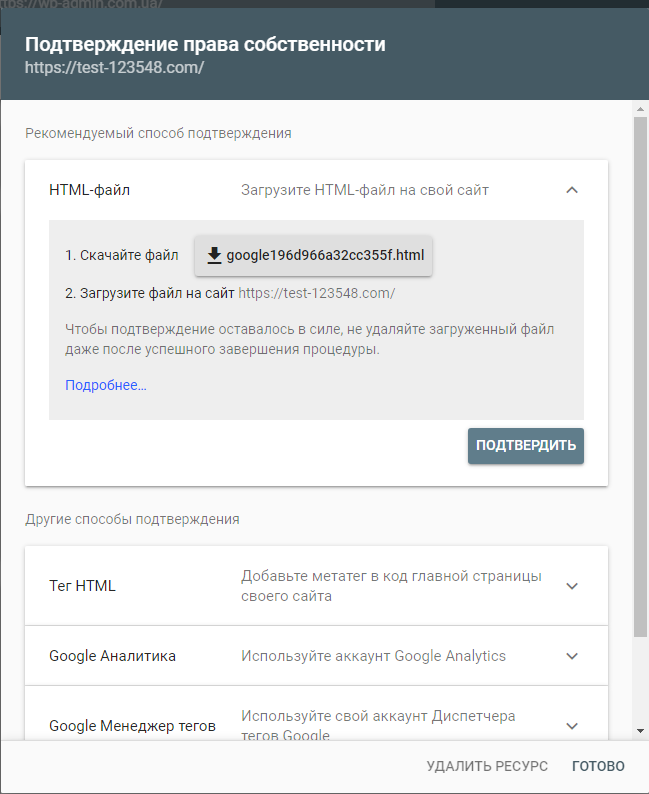
There is also the possibility of verification through Google Analytics or Google Tag Manager, but these options for beginners will be more difficult, and not always you have a registered Google Analytics or Google Tag Manager.
What's next and where to start learning Search Console
The most correct and easiest way is to start studying the interface and then move on to a detailed review of all important sections..
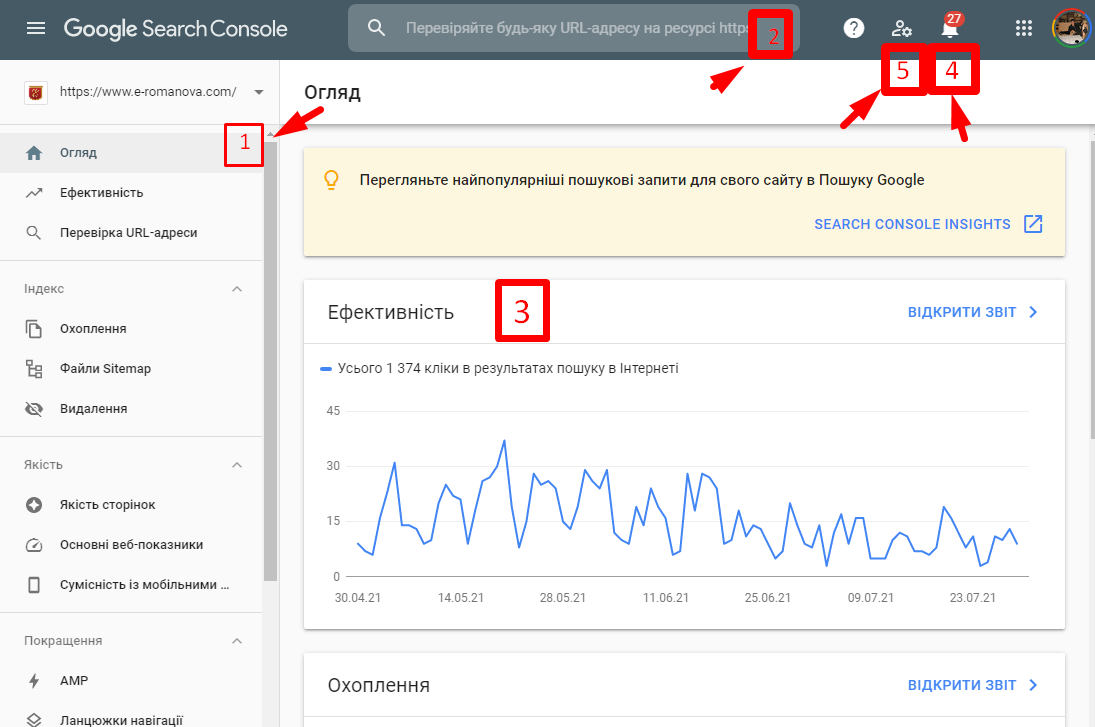
- Main menu, where is the easiest way to get to any of the sections. The menu is constantly growing and new tools appear. It can also be supplemented depending on how the site is configured.. New items often appear, for example, when adding new microdata or introducing AMP pages.
- Checking if pages are in the index. If you are not sure if your page is in the SERP and how Google Bot sees it, you can check such a page directly in the Google Search Console and if the page is not in the index, then it can be added.
- Blocks with information. These blocks can be in the form of graphs or tables., usually show data for the section selected on the left side.
- Messages. From time to time, Google will notify you about how the site is performing in the SERPs., if there is a problem with the site, errors in different types of content, when a website is infected with a virus … All notifications will be collected in this section, by clicking on the bell.
- User settings. If you are logged in with the same login when searching on Google, which is used in Search Console, then when you search for a site for various queries, Google may display an additional block with information about your site, regarding the request entered into google directly in the search results, if this block bothers you, you can turn it off under user settings.
Exploring the menu items
On this we have finished with the main points and can proceed to the study of information, provided by Google Search Console.
Menu item Overview
In the menu item Overview you can see the main information blocks, such as:
- Efficiency – shows how many clicks were made to your site during the quarter. It is convenient to study transitions in dynamics on a time interval.
- Coating – shows, how many pages do you have in search, how many of these pages have errors, and which google considers problem-free.
- Quality – shows, how many pages on your site Google considers desktop and mobile friendly. For any of the items “Convenience of pages”, “Basic internet indicators”, “Mobile friendly” you can click and go to a more complete report. Noticed by me, that these parameters are updated quite infrequently and may pass 1-3 months until they are updated after improving the site.
- Improvements – additional improvements, which the developer made on the site and information about how these improvements work correctly. This clause may include sub-clauses such as “AMP Pages”, “Navigation bars”, “Chavo”, “Check the code”, “Link search box”… Actually depending on the site in paragraph “Improvements” there may be different sub-items.
When viewing these blocks, you most likely noticed the link in the upper right menu of the block “Open report”. This link allows you to go to the full version of the report.
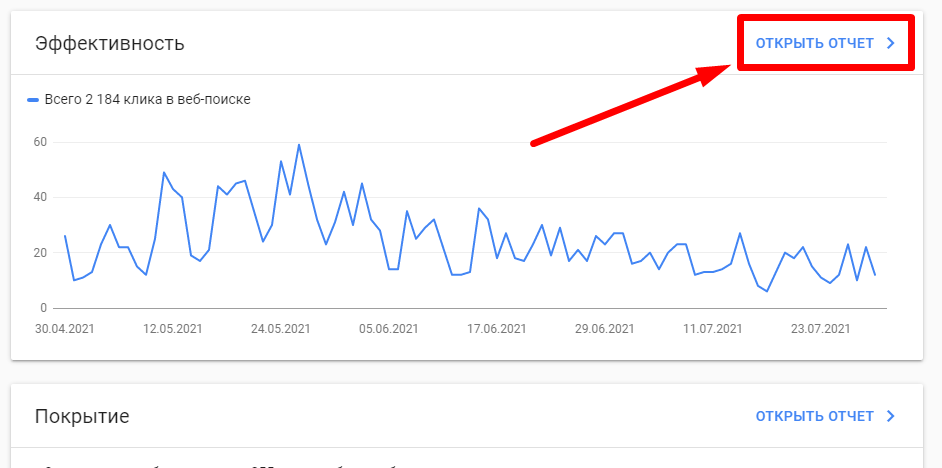
In the block “Efficiency” Click on the link “Open report” as shown in the picture above and you will be taken to the expanded report on the page “Efficiency” for 3 months. This is the most popular and useful menu item for us.. With it, in the future we will be able to plan publications and understand what keywords people find, and also which pages google leads people to for certain keywords. Let's study this menu item in more detail..
Menu item “Efficiency” в Google Search Console
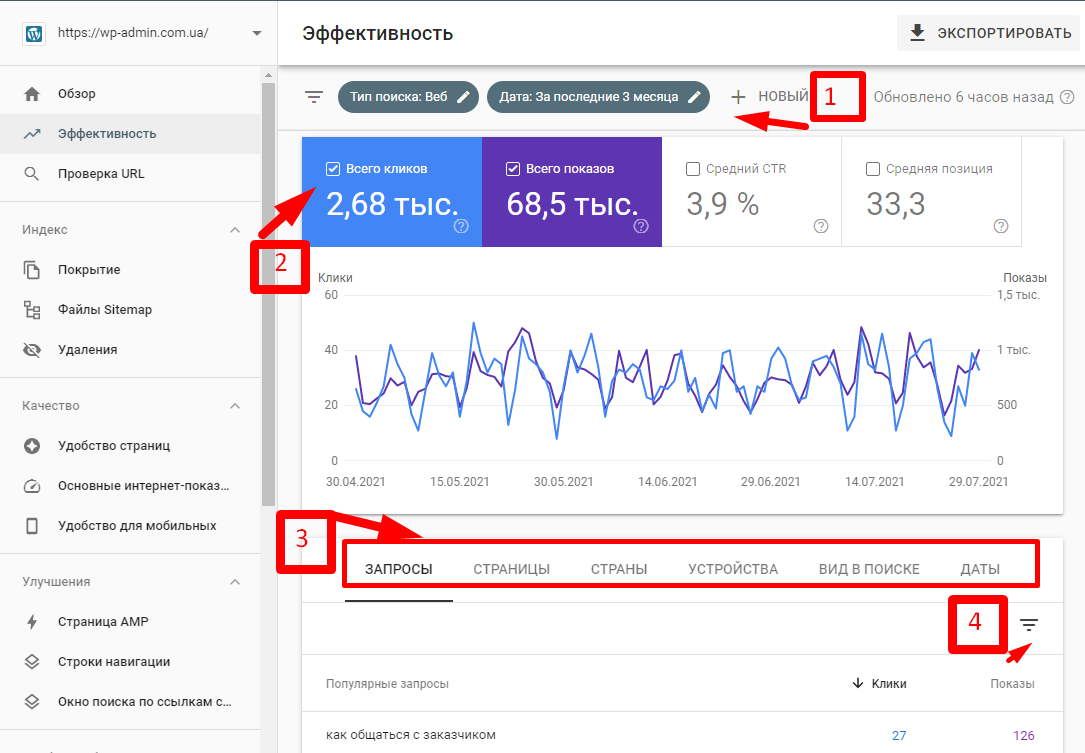
- Filter, which helps to display data more accurately. Here we can change the period, for example, view data for 3, and for 1 month or vice versa 1 year. When you change this filter, the data on the graph and in the table changes..
- Chart Tabs. With these tabs you can turn the data on or off on the chart..
- Sections in the table. By switching between sections, you can see the basic data on the site for the period selected above. Can see requests, pages, countries from which people came, devices, “view in search” (what materials bring how many visitors), dates (number of visitors on a given date).
- Filter in the table. Works differently depending on which section is selected. For example, in the requests section, you can enter a part of a word and see how many and what requests contained your word or part of a word, and also how many times they were searched. We will study in more detail in the practical part of the course..
Menu item “Check URL“
This item does the same as the search bar above., it helps to check if the page is in the search. If there is no page, then it can be sent for indexing or reindexing with new changes, this will speed up their getting into the search.

Menu item “Coating“
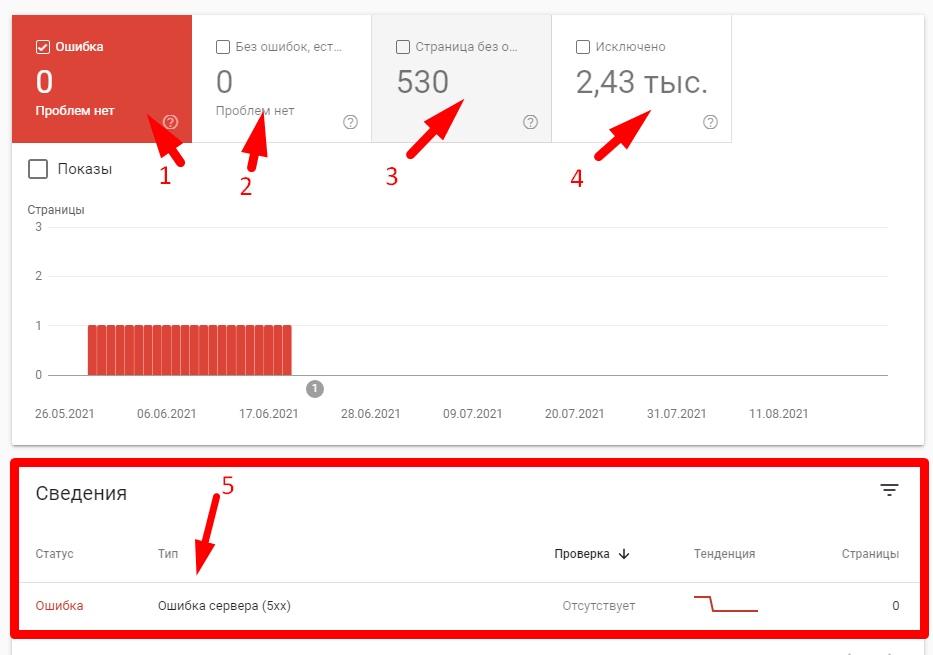
In this paragraph, you can see errors and useful information about your site.:
- Error. How many critical errors on the site
- Without mistakes, there are warnings. How many problematic pages on the site.
- Page without errors. How many pages were indexed correctly.
- Ruled out. How many pages were excluded from the index for one reason or another.
- Intelligence. Summary table of errors or problems.
Including each of the items on the diagram, you will be able at the bottom of the paragraph “Intelligence” see additional information on errors on your site.
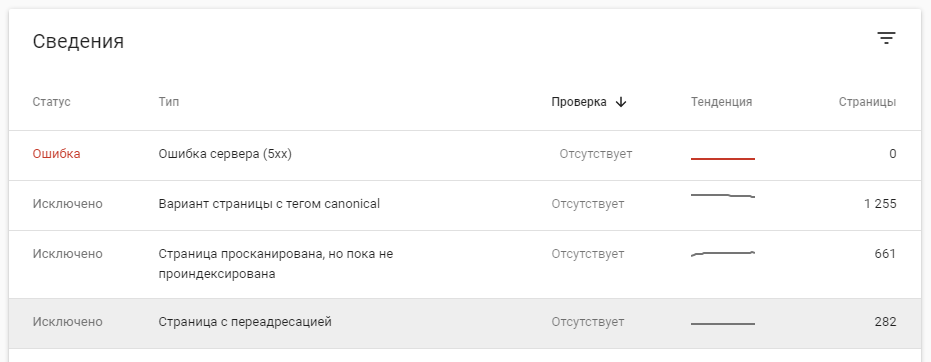
If you click on one of the items, you will see detailed information on the pages, with which there are problems. On the slide above you see an example of a highlighted line with an error type “Pages with redirects”, when you click on it you will have the following picture.
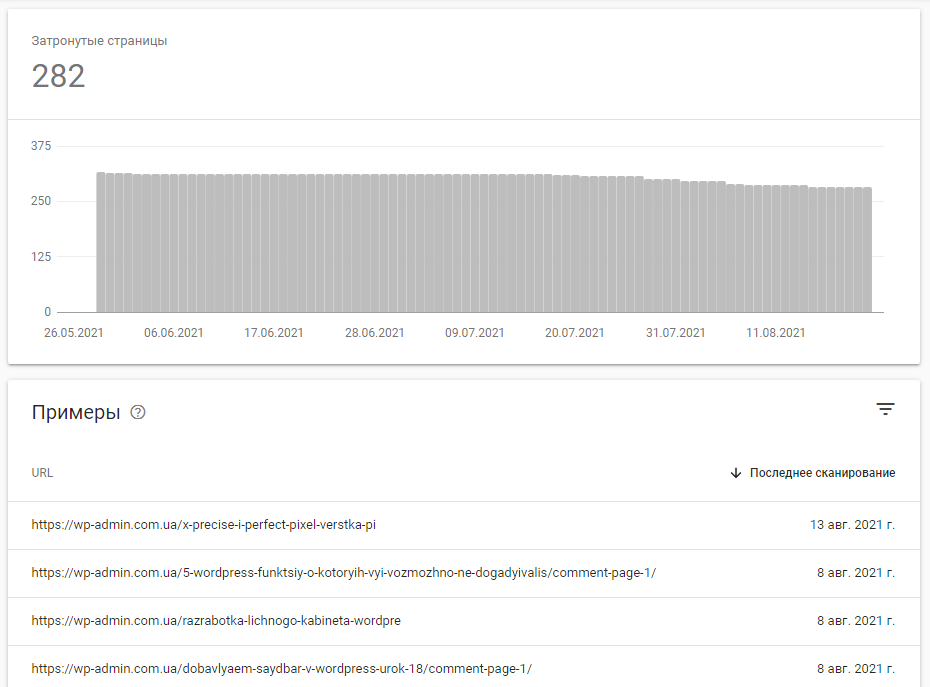
Clicking on any of the links in the examples will take you to detailed information on each page.. And then the site check usually begins and the routine monotonous, but very important, this is a search in google and help how to fix the error.
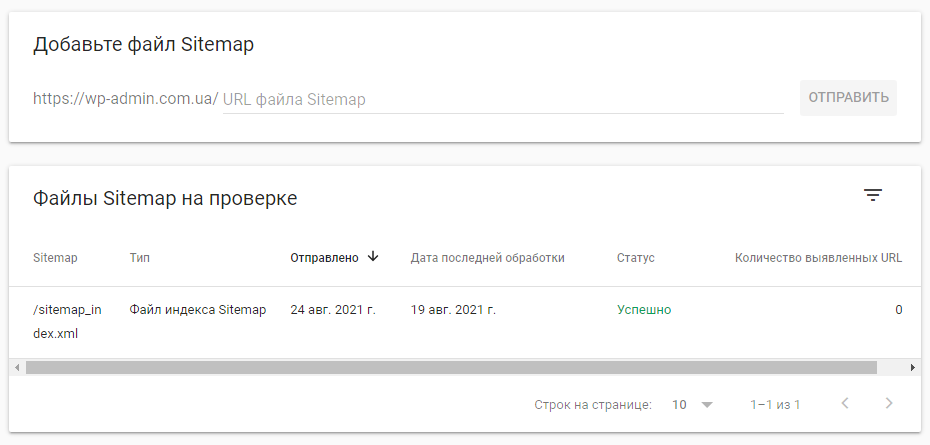
Menu item “Sitemaps“
In this menu item you can add XML maps of your site. For those, who does not know explain. An XML sitemap contains all the pages on your site and is usually located at “your-site/sitemap.xml”. If you add it, then it will be easier for Google to understand where you have important pages, and which are just technical. Site indexing will be faster. By the way, there can be several sitemaps and this is normal.. Sometimes when the site is very large, the sitemap is split into several and submitted to google.
Menu item “Removal“
In this section, you can create a request to temporarily remove pages from the index, for permanent deletion, it will be useful to add the page to robots.txt and create a robots meta tag with the noindex parameter.
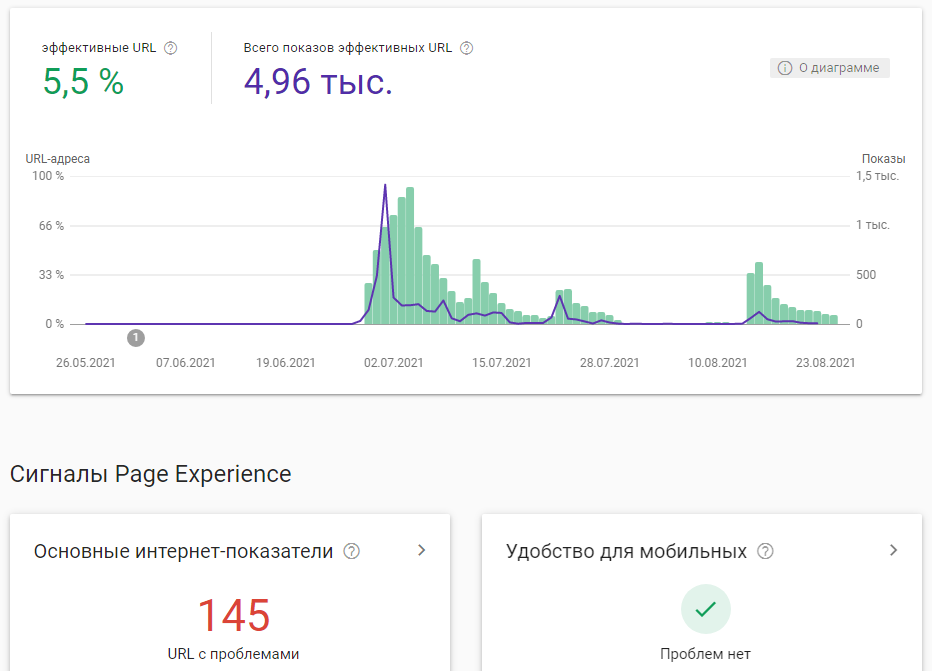
Menu item “Convenience of pages“
Basically, the following indicators are important in this:
- The presence of https. Setup ssl protocol.
- Mobile friendly. Basically how well the site adapts to mobile devices. This block will take you to the menu item “Mobile friendly”.
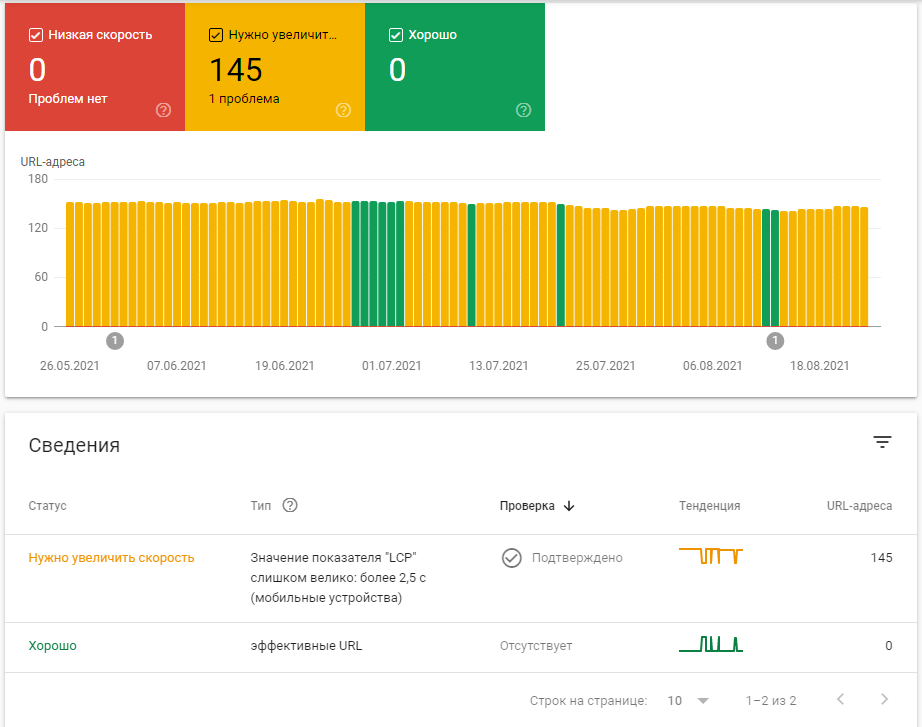
- Basic internet indicators. Basically, these indicators are affected by the loading speed of each page., the loading speed of the first screen and in general indicators that are used for Web Vitals. You can evaluate the performance of Web Vitals in more detail using a special apps in Google Chrome browser “Web Vitals”. When you click on a block, you get to the point “Basic internet indicators” below.
Menu item “Basic internet indicators“
I will not repeat, I have described above, how this item works.
Menu item “Mobile friendly“
Except mistakes, which you can find in this paragraph, you can also check your website page on the following resources:
- https://search.google.com/test/mobile-friendly?hl=ru
- https://developers.google.com/speed/pagespeed/insights/
Improvements
There can be a variety of items in improvements, depending on what markups are configured on your site..
Menu item “Links“
Shows, what external and internal links does google see, regarding your site.
List of Mini Course Topics
- How does Google Search Console and Google Analytics work and what is the difference between them?
- Program interface. How to view website data and how to use it, work with data filtering and export?
- How to update, expand content and launch it quickly for rechecking? How to choose new keywords for the site?
- How to work with links in Google Search Console?